
What are Weather Fronts?
Fronts
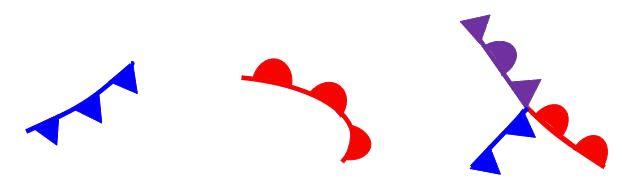
Have you ever looked at a weather map and noticed blue curved lines with blue triangles? Or how about red curved lines with red half circles? Or even purple lines with both purple triangles and purple half circles? These lines mark what are known as fronts moving across an area.
A front can be defined as the transition zone between two air masses of different temperature and humidity. Fronts can extend over a very short distance (30 miles) or over a very long distance (100 miles). The frontal zone represents the boundary between the two different air masses. If the cold air mass is moving into an area of warmer air, the front is called a cold front. If the warm air mass is moving into an area of cooler air, the front is then called a warm front.
Types of Fronts
The type of front depends on both the direction in which the air mass is moving as well as the characteristics of the air mass. We will discuss the following 2 types of fronts: cold front and warm front.
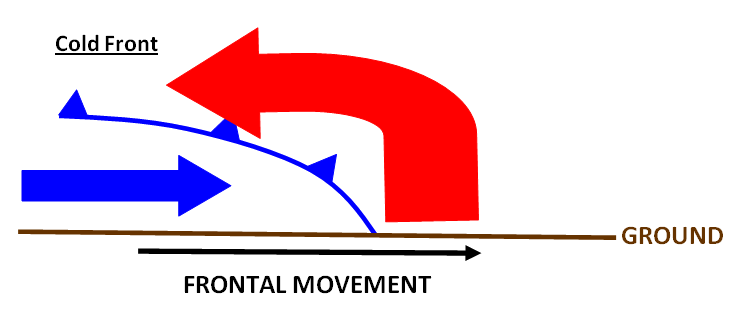
A cold front can be defined as a front in which a cold air mass is replacing a warm air mass at the surface.
Characteristics of a cold front:
- The air behind a cold front is noticeably colder and drier than the air ahead of it.
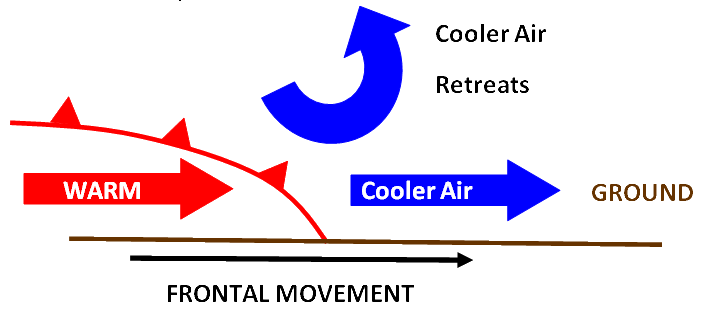
- As seen in the picture above, friction slows the advancing cold air and causes a steep slope to the front.
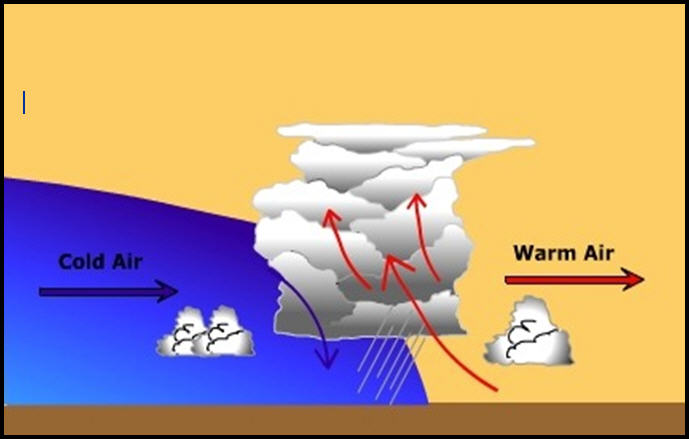
- As seen in the picture above, this steep slope pushes the air ahead of it rapidly upwards and vertically developed clouds (cumulus) are produced along the front.
- Cold fronts can be associated with cirrus clouds well ahead of the front, strong thunderstorms along and ahead of the front, and a vast area of clouds immediately behind the front (although fast moving fronts may have mostly clear skies immediately behind them).
- Cold fronts can bring the most violent weather among the different types of fronts.
- Cold fronts are sometimes associated with squall lines (Squall lines are comprised of storms that organize into a linear structure and can be more than 100 miles long).
| Atmospheric Variable | Before the Cold Front Passes | While the Cold Front is Passing | After the Cold Front Passes |
|---|---|---|---|
| Atmospheric Pressure | Steady decrease | Lowest decrease in pressure, then sudden increase | Steady increase |
| Temperature | Warm | Sudden decrease in temperature | Steady decrease in temperature |
| Dew Point | Increase in dew point temperature; humid | Sudden decrease in dew point temperature | Dew point temperature begins to fall |
| Winds | Southwest to Southeast (Northern Hemisphere) | Wind direction begins to shift; gusty winds | West to North (Northern Hemisphere) |
| Weather Conditions | Scattered showers and Thunderstorms | Thunderstorms (may be severe) | Scattered showers followed by clearing conditions |
| Clouds | Increasing Cirrus, Cumulonimbus | Cumulonimbus | Decreasing clouds may occur based on the speed of the front; Cumulus |
How Cold Fronts are Used and Detected on Weather Maps
The symbol that is used to identify a cold front on a weather map is a blue line with triangles that point in the direction in which the cold front is moving. The line is represents the leading edge of the cooler air mass.
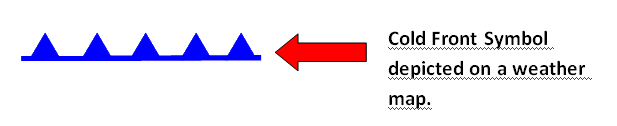
Now that we know about the symbol that represents a cold front, let´s look at how these symbols are used in weather forecasting! What do they look like in the real atmosphere and how are they represented on weather maps? Let´s start out simple and work our way up to a more complex understanding of fronts on weather maps. Below is a basic understanding of how a cold front is represented on a weather map.
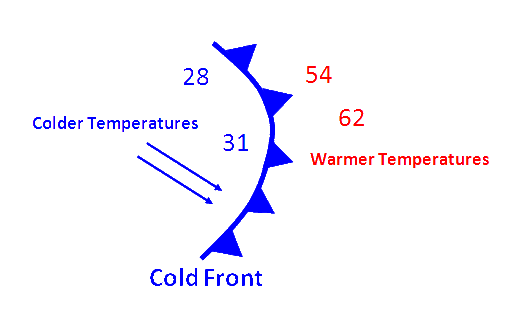
Notice the temperature change from one side of a cold front to the other. In the map of surface temperatures above, the station east of the front reported a temperature of 54 degrees Fahrenheit while a short distance behind the front, the temperature decreased to 28 degrees. An abrupt temperature change over a short distance is a good indicator that a front is located somewhere in between.
Exercise
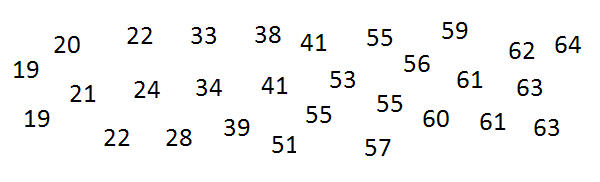
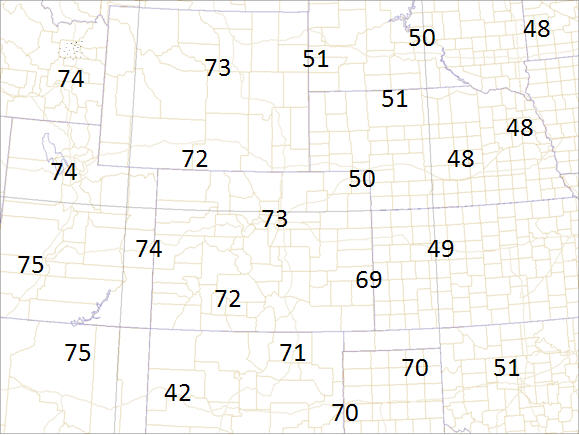
Now that we have done some exploring about the basics of cold fronts on weather maps, let´s try an example of finding a cold front on a weather map! Can you identify where the cold front should be? After you find where the cold front is, use the proper symbols to identify that it is a cold front (a blue line with blue triangles). *Remember, the triangles point in the direction in which the cold front is moving, which is towards the warmer air.
 Click here to see the answer
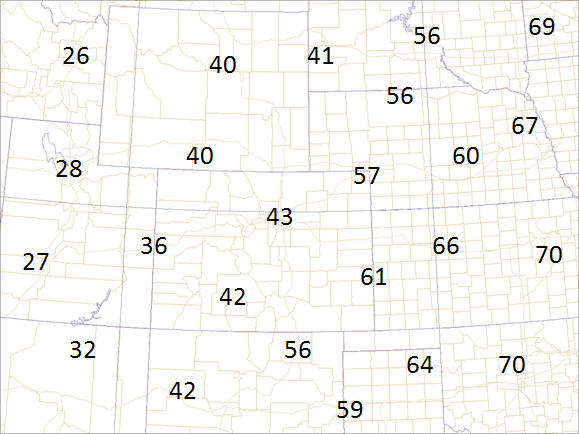
Now how about finding a cold front on an actual weather map? Use appropriate frontal symbols to identify the cold front!
 Click here to see the answer
What is a Meteogram
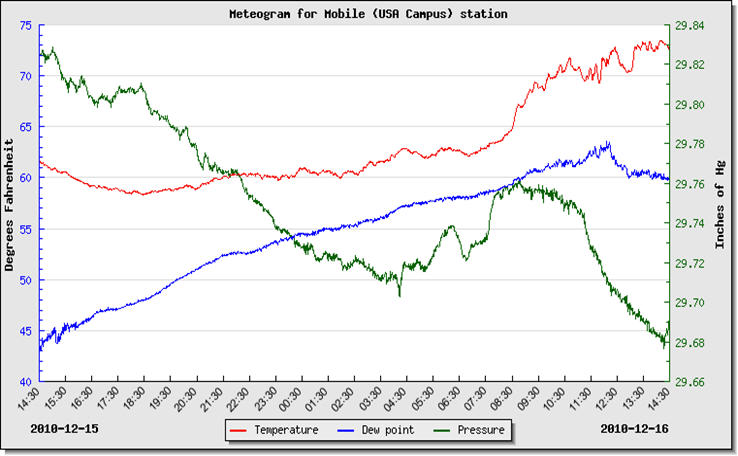
Although weather maps are good for giving an overall perspective of the "big picture", they can be difficult to help determine what will happen in your particular city. Therefore, meteorologists can detect fronts not only on weather maps, but also by looking at a chart known as a meteogram. A meteogram is a time cross-section of data for a specific reporting station. The data plotted include temperatures, winds, pressure, clouds and present weather. The figure below shows an example of a meteogram.
In a meteogram, time progresses from left to right across the bottom of the figure above. By looking at a meteogram, meteorologists can see how weather conditions change over a time period.
How to Detect Cold Fronts on a Meteogram
We saw above that when a cold front comes through, the pressure and temperature both drop, the winds shift from a primarily southerly direction (coming out of the south) to a more westerly or northerly direction, and tall clouds form. The table above also mentions something called a dew-point temperature. This is a variable that measures the amount of humidity in the atmosphere: the smaller the dew-point, the drier the air. Formally the dew-point is defined as the temperature to which an object must be cooled for dew to form on it. We all know that dew forms on cold objects, e.g. on a cold glass of soda with ice, or on grass and cars (that are parked outside) in the early morning. This happens in the early morning because the sun goes down during the night and, therefore, the air and objects in it cool off. The amount of cooling that needs to happen for dew to form, gives you an idea of how humid or dry the air is. For example, if you are sitting inside an air-conditioned room drinking a class of cool water of say 60° Fahrenheit, there probably will be no condensation (or dew) on the outside of your glass. Remember air-conditioning dries the air! This means the dew-point temperature of the air in the room is less than 60° F. Now add some ice to the water, does dew form? Yes! The temperature where that happens is your dew-point temperature. Now take your glass of 60° F water outside on a hot and humid south Gulf Coast summer day. Will dew form? Yes! Therefore, the dew-point temperature is at least 60° F, but it could be even higher. Let´s go back to our cold fronts. Ahead of a cold front the air is warm and moist, which means it will have a higher temperature and dew-point. Air behind a cold front is cold and dry, in other words it will have a lower temperature and dew-point. So when you look at your meteogram as a cold front is passing through, you will see the pressure, temperature, and dew-point all fall. Simultaneously, the winds will shift direction and tall clouds will form.
The meteograms shown below are very detailed. Time is shown along the horizontal axis (in Greenwich Mean Time units). Temperature, cloud elevation, and pressure are shown along the vertical axes of the 3 panels. Let´s focus on just the variables discussed above. In the top panel, the temperature and dew-point (the lower line) are shown. The wind speed and wind direction are indicated by the barbs attached to the circles. The barb points in the direction the wind is coming from. For example, at 09 Greenwich Mean Time the wind is northeasterly (it blows out of the northeast). The number of lines on the barb indicate the wind speed (the more lines, the stronger the wind). The middle panel gives the height in the atmosphere where clouds are observed and the bottom panel shows the air pressure.
Exercise
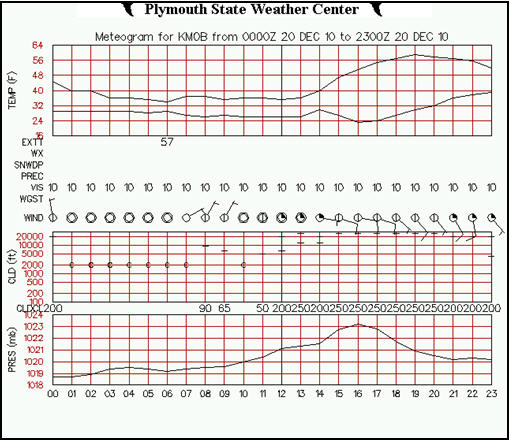
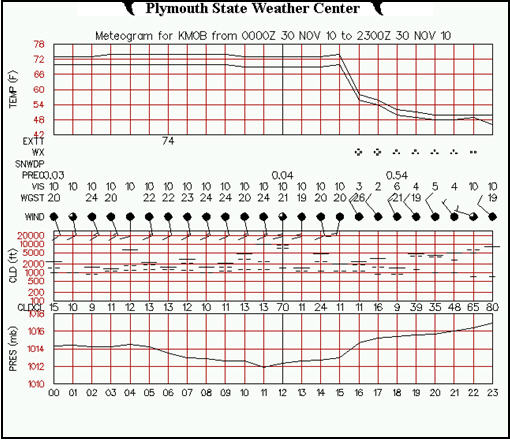
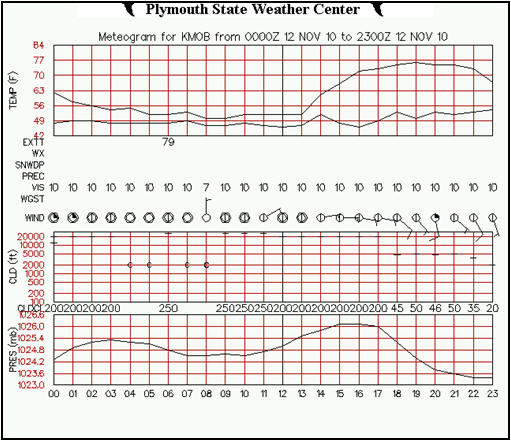
Now that you have learned how to detect a front on a meteogram, let´s try an example! There are three different meteograms pictured below (each from a different day and time). Can you identify which meteogram shows a cold front moving through the area? Remember to look at variables such as temperature, dew point and pressure!
 Click here to see the answer
The center meteogram shows a cold front coming through. First, you see a steady drop in the pressure (bottom panel) while the temperature and dew point hold steady and the winds are blowing from a southerly direction. Then, very abruptly the temperature and dew-point fall and the winds shift, while the pressure rises steadily. This is the actual time of FROntal PAssage or FROPA! In the example this occurs between 3 and 4 pm Greenwich Mean Time in the afternoon.
Warm Fronts
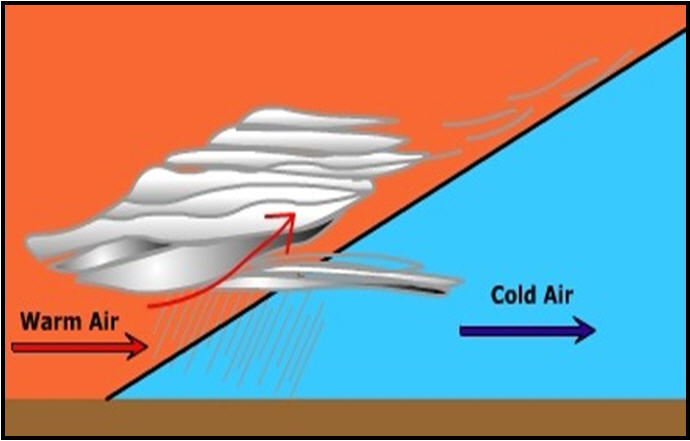
A warm front can be defined as a front in which a warm air mass is replacing a colder air mass at the surface.
Characteristics of a warm front:
- The slope of a warm front is much more gradual than a cold front.
- Warm fronts are associated with a frontal inversion (the warmer air overruns the colder air).
- Warm fronts typically produce less violent weather than cold fronts.
- Warm fronts are associated with areas of gentle ascent (i.e. stratiform clouds and precipitation).
- Clouds and precipitation are quite prevalent ahead of the warm front.
- Warm fronts typically move much slower than cold fronts.
- Warm fronts can be associated with cirrus, altostratus, altocumulus, and stratus clouds as well as occasional fog.
| Atmospheric Variable | Before the Warm Front Passes | While the Warm Front is Passing | After the Warm Front Passes |
|---|---|---|---|
| Atmospheric Pressure | Steady decrease | Becomes steady; leveling off | Steady rise followed by a slight decrease |
| Temperature | Cool with a gradual warming | Steady warming | Warming then becoming steady |
| Dew Point | Steady increase | Steady | Increase then becoming steady |
| Winds | South to Southeast (Northern Hemisphere) | Variable | South to Southwest (Northern Hemisphere) |
| Weather Conditions | Light to moderate Rain, Snow, Sleet, Drizzle | Drizzle or no current weather conditions | Sometimes light rain |
| Clouds | Increasing; Cirrus, Altocumulus, Altostratus, Stratus | Stratus | Clearing with scattered stratus |
How Warm Fronts are Used and Detected on Weather Maps
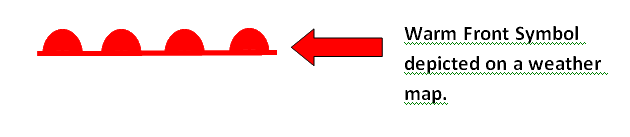
The symbol that is used to identify a warm front on a weather map is a red line with half circles that point in the direction in which the warm front is moving. The line represents the leading edge of the warmer air mass.
Now that we know about the symbol that represents a warm front, let´s look at how this symbol is used in real life! Below is a basic understanding of how a warm front is represented on a weather map.
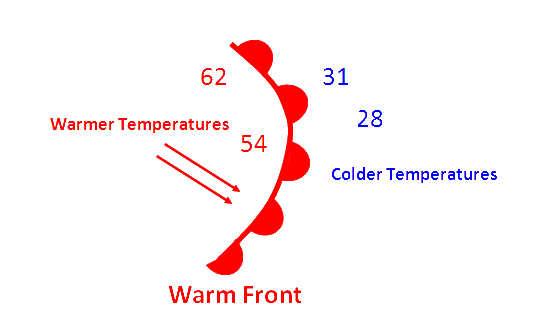
Notice the temperature change from one side of a warm front to the other. On the map of surface temperatures above, the station east (or ahead) of the front reported a temperature of 28 degrees Fahrenheit while a short distance behind the front, the temperature increased to 62 degrees. An abrupt temperature change over a short distance is a good indicator that a front is located somewhere in between.
Exercise
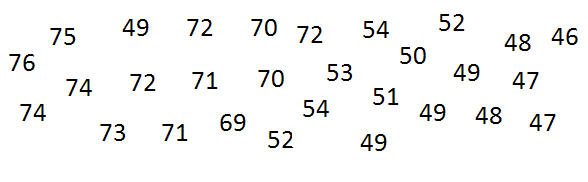
Now that we have done some exploring about the basics of warm fronts on weather maps, let´s try an example of finding a warm front on a weather map! Can you identify where the warm front should be? After you find where the warm front is, use the proper symbols to identify that it is a warm front (a red line with red half circles). *Remember, the half circles point in the direction in which the warm front is moving, which towards to colder air.
 Click here to see the answer
Now how about finding a cold front on an actual weather map? Use appropriate frontal symbols to identify the warm front!
 Click here to see the answer